Mobile app usage reaches an all-time high: Sessions, time spent in-app, and beyond

Prashansa Shrestha, Content Writer, Adjust, Jun 20, 2022.
Mobile usage has skyrocketed over the last few years. Early on in the COVID-19 pandemic, more users than ever turned to apps for shopping, entertainment, and completing daily tasks than ever before. But, with much of the world opening back up, the number of app downloads is predicted to decrease—or stabilize—in the coming years. According to eMarketer and Insider Intelligence’s research, in 2022, users in the U.S. will access an average of 20.4 apps each month, which will drop to 19.7 in 2026. However, it’s important to note that the number of apps installed on a smartphone does not reflect user engagement. Besides, the same research revealed that the average time spent on mobile in the U.S. rose 4.1% last year to 3 hours and 19 minutes in 2022 so far.
Installs are only one of the metrics used to assess the state of the app economy. We also analyzed global app sessions, session lengths, the total number of sessions per user per day, and time spent per user per day to determine patterns around the increase in app usage.
Sessions and time spent in-app continue to rise in 2022
Global sessions for all verticals grew significantly in the last two years, posting 20% year-over-year growth in 2020 and an additional 2% in 2021. The first quarter of 2022 has performed well above the yearly average of 2021, with a session boost of 9%. This demonstrates that mobile apps are playing an integral role in the everyday lives of users around the world despite many returning to their workplaces and emerging from lockdowns and restrictions related to social distancing—both of which played a huge role in the surge of mobile use.

The total number of sessions per user per day increased slightly in Q1 2022 compared to Q4 2021, climbing from 2.05 sessions on day 1 in Q4 2021 to 2.07 sessions on day 1 in Q1 2022. For day 30, the number of sessions in Q4 2021 and Q1 2022 remained the same, hovering at two. This is an important detail, as it suggests that users in 2022 are remaining just as active in-app in 2022 30 days into the user journey.

While session numbers have steadily climbed year-on-year, session lengths have decreased slowly. The average session length in 2020 was 20.1 minutes, which fell to 19.9 in 2021 and 19.1 minutes in Q1 2022. This can theoretically indicate declining user engagement, however, the real cause of the drop in session lengths is the high volume of sessions, and the increase in users turning to mobile for tasks, events, and activities that don’t require as much time, such as payments. Depending on an app’s business goals, marketers can optimize their user experience (UX) to either increase session lengths or make it easier for users to complete a task in a shorter time.

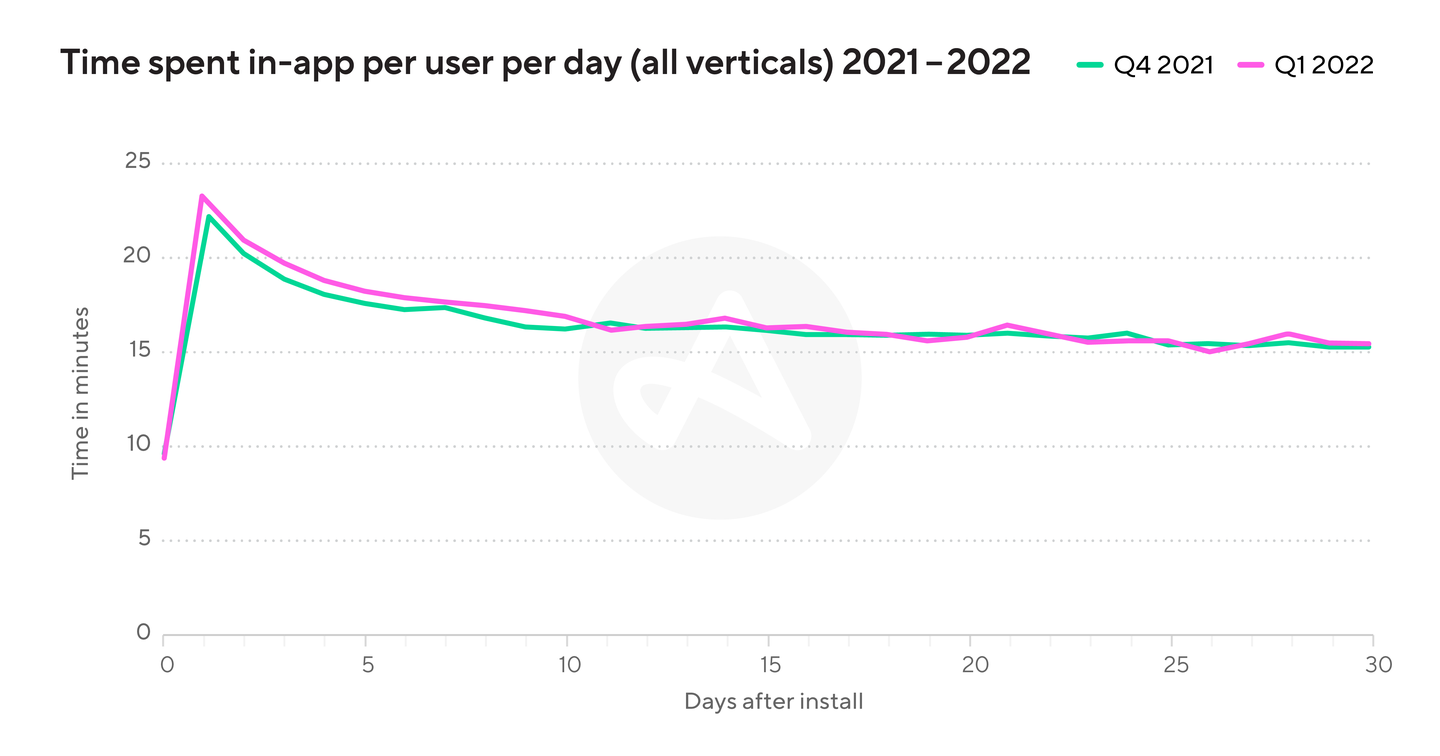
We also took a look at the total time spent in-app per day to ascertain how many minutes each session accounts for. Q4 2021 started with a day 0 average of 9.6 minutes, jumping to 22.8 over 24 hours. By day 3, it descended to 19.2 minutes, hit 17.7 on day 7, and settled at 15.4 by day 30. In Q1 2022, users spent a little more time in-app compared to the preceding quarter. Following a similar pattern, day 0 posted 9.4 minutes, hiking up to 23.3 on day 1, then dipping to 19.7 on day 3, 17.7 on day 7, and 15.4 on day 30. Again, this illustrates that once users install an app, they consistently use it for a significant amount of time each time they log in—even if those session lengths are decreasing somewhat.

App installs not slowing down anytime soon
Along with sessions and time-spent in-app, installs are also trending upward. In fact, global installs for all verticals surged 21% from 2019 to 2020 and grew another 23% in 2021. Compared to the yearly average of 2021, installs were also up by 13% in Q1 2022. It may be the case that the number of apps users regularly engage with on each device is down, but it does not mean that the overall installs have dropped, or that interest in apps has decreased. This is also in-part the result of the average number of mobile devices and connections per person increasing globally. The chart below also demonstrates that following a dip and normalization after the first wave of lockdowns in 2020, installs have increased to the point that the pandemic-driven heights are now normal.

Huge shakeups to the industry and the world, like a pandemic or even Apple’s spearheading of privacy changes, continue to reshape the way consumers interact with mobile, and how marketers and developers can meet their needs. User habits and expectations, as well as the mobile ecosystem, are ever moving and changing, which is why it's crucial to remain agile and open minded with the products and services we provide. As the market becomes more saturated, it is essential for marketers to continuously improve their user acquisition (UA) strategies and UX to minimize churn and maximize ROI. As Adjust, we’re always working on next-generation solutions to help our clients drive growth and create seamless user experiences. If one thing is for certain, app growth isn’t slowing down anytime soon.
For more insights on trends shaping the mobile app industry, check out our latest Mobile App Trends Report 2022: A global benchmark of app performance.
Be the first to know. Subscribe for monthly app insights.
